There is a new paradigm of energy transition emerging. In several important sectors, the transition is now endogenous, driven by the achieved or imminent competitiveness of low-carbon technologies. This is the case notably for the power sector, energy efficiency, and increasingly for segments of the personal transport sector. However, other sectors such as industry and heavy transport are lagging behind. These sectors are particularly relevant for developing countries, which have large unmet material and freight transport needs. The whole international policy environment needs to evolve to reflect the new paradigm. International funding, research, and demonstration needs to shift toward shifting the frontier of decarbonization options into the hard to abate sectors.
Challenge
Problem Statement
Energy is a crucial input to development. Dramatically increased inputs of energy have been required by all countries that have seen rapid rises in incomes. For two centuries since the industrial revolution, this development has been powered first and foremost by coal. The Figure below shows to what extent the early industrializers’ development was driven by coal. Later industrializers such as China have also powered their development with coal, albeit to a lesser extent because other energy carriers such as oil and associated end-uses were also available by the time these countries began their rapid phase of catch up growth. For example, in 1950 coal still supplied 91% of the UK’s primary energy, while UK income per capita was around 9500 USD2011 PPP. By the time China reached a comparable income level (2010), coal supplied only 70% of China’s primary energy, as other energy carriers had already assumed a much more important role (1). In the case of India, relatively higher levels of development have been achieved with relatively lower coal inputs. This is due to the Indian economy’s high energy efficiency and deployment of other energy carriers (notably crude oil). (2)
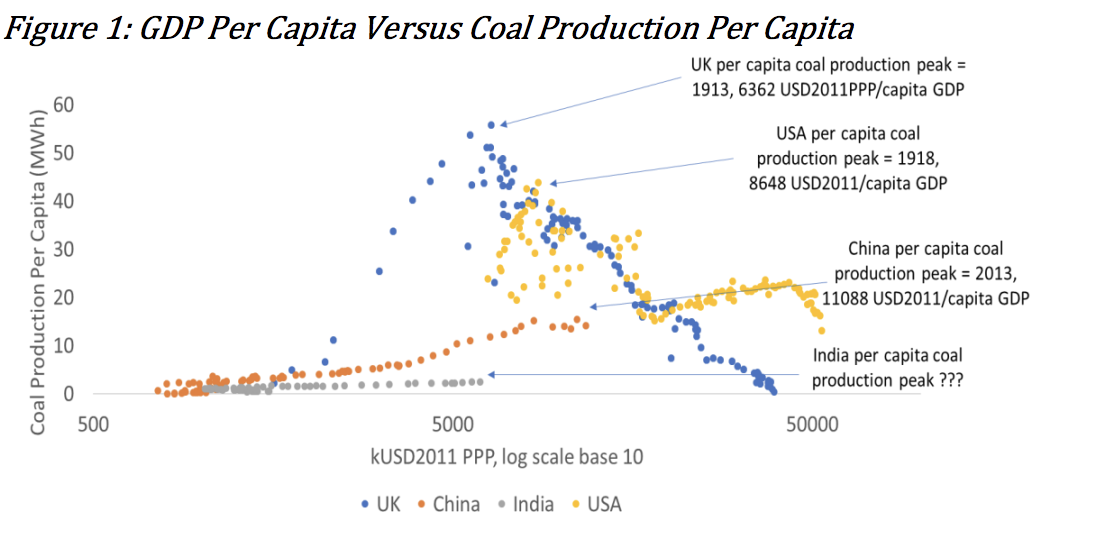
Source: TERI 3. It should be noted that the data here are only for production, not consumption including imports. However, on the timeline of peak, all countries were in relative autarky, with imports playing a minor role. UK data from 1700 to 2016, USA data from 1900 to 2016, China data from 1900 to 2016, India data from 1913 to 2016
Thus, the energy transition away from coal has already been underway for some time, with late industrializers able to achieve comparable levels of income per capita as early industrializers, but with much lower coal consumption. This is because late industrializers have been able to benefit from huge efficiency improvements in the efficiency of transformation. They have also benefited from a diversification of the fuel mix, as oil, natural gas and more recently renewables have become available and affordable even for countries at much earlier development stages.
However, there are a few problems with this narrative. Firstly, although a relative transition away from coal’s role as the dominant fuel of industrialization is well and good, in absolute terms the global consumption of coal has continued to rise, not fall (although it has been roughly stable over the last few years). In mainstream forecasts, global coal demand is projected to be roughly stable in the near-term, before declining gradually. This absolute transition is projected to occur too slowly, however, to mitigate climate change. Secondly, the fuels that have reduced coal’s relative importance for late industrializers have been largely crude oil and natural gas, and only more recently renewables.
The key question for climate mitigation is whether developing countries can continue to “tunnel under” the coal-development Kuznets curve, but this time substituting coal for renewables and zero carbon energy carriers.
Proposal
Implications of a New Paradigm
The good news is that the elements of a new energy-development paradigm are emerging, although they are not yet complete. These consist of:
Huge improvements in technical and potentially “macroeconomic efficiency”: There have been very significant improvements in end-use energy efficiency over the last 10-15 years, in the order of 50-96% depending on the equipment in question (4). This has occurred while still lowering real prices of energy services. A second trend can be termed macroeconomic efficiency. The current trend of premature deindustrialization implies a precocious jump directly into services, with a truncated industrialization.
We can see this in a comparison between the USA and India. Between 1889-1938 manufacturing averaged 25% of US GDP, compared to 16% in India for the period 1960-2017 (5). There are legitimate concerns about the implications of this trend of premature deindustrialization for low-skilled job creation and inequality (6), but this development paradigm does have the potential to be much more energy efficient. We can call this the “higher, earlier but less paradigm”: in the future, developing countries are likely to achieve higher levels of energy services, earlier in the development process, and with less energy inputs.
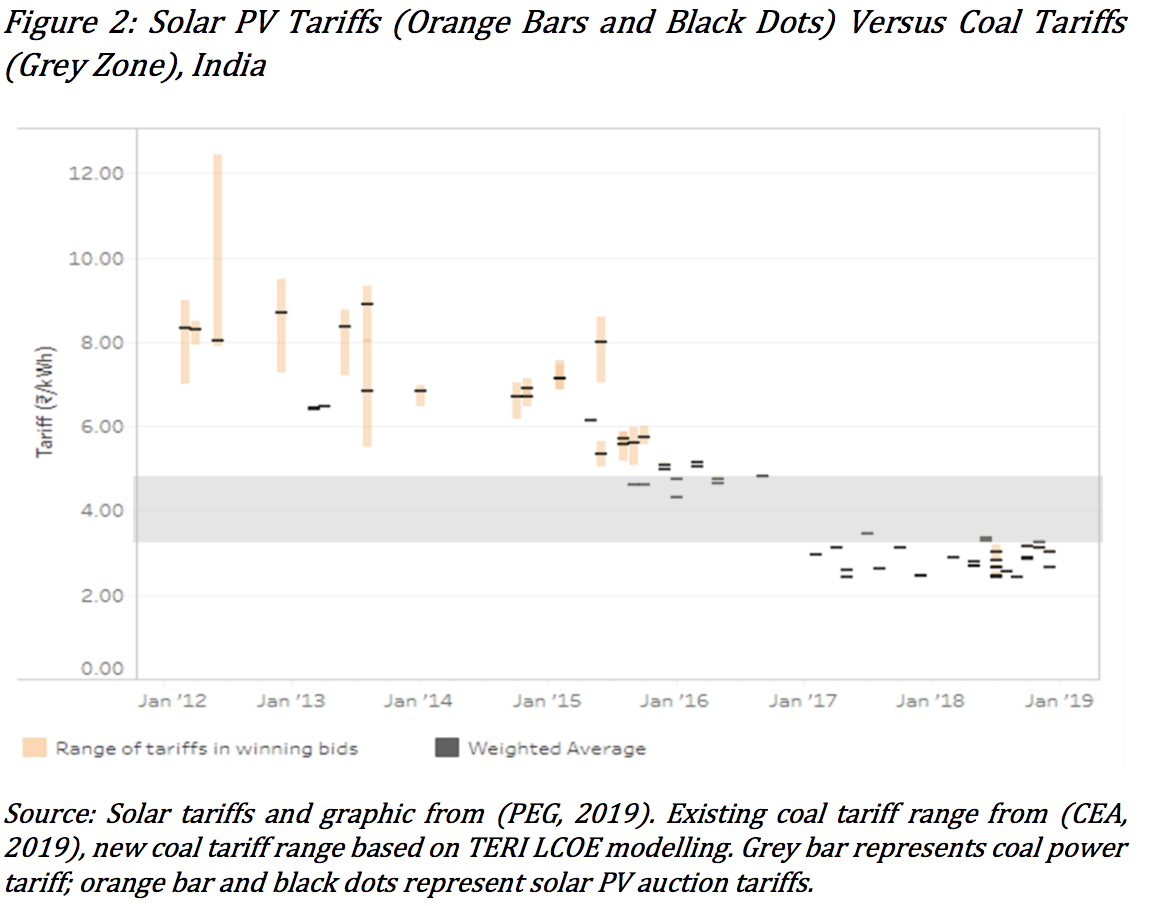
Coal is no longer king on costs, but it still is on convenience: for most of the history of industrial energy production, coal was king on availability and energy security; costs, and convenience for the production of electricity. However, with the substantial decline in wind and solar energy capital costs, and the gradual improvement in capacity factors, coal has been overtaken by wind and solar in almost all geographies. We can illustrate this with the case of India. Since 2012, solar tariffs, as revealed by competitive reverse auctions, have fallen from 10- 12 Rs/kWh to 2.50-3.00 R/kWh (ca. 35-43 USD/MWh). For comparison, the capacity weighted average tariff from the existing coal fleet is in the order of 3.70 R/kWh (53 USD/MWh), with the LCOE of new plants coming in at above 4.00 – 4.50 Rs/kWh (57 – 64 USD/MWh).
However, coal is still king in terms of convenience. We can consider the issue of convenience on two parameters. Firstly, the rate of feasible scale-up. This is important because developing countries experience rapid economic growth, and concomitant growth of electricity demand, often faster than GDP. For example, in the early decades of India’s electrification, India’s electricity generation grew at 10-11% per year, several percentage points faster than economic growth, thanks notably to the addition of large hydro projects with significant economies of scale. Consider the hypothetical case of a country with a demand growing a 7% per year. In ten years, it will roughly double. If the starting demand were a hypothetical 100 TWh, this would necessitate a linear supply growth of about 10 TWh per year. At a capacity factor of 75%, meeting this from coal would require the addition of 1.5 GW of coal plant per year, or slightly over two new units of 660 MW per year. Meeting incremental demand from solar PV would require 6 GW per year, or the commissioning of 12 large scale solar parks every year (assuming a solar park size of 500 MW). Or, if it is to be distributed rooftop PV, installations on 2.9 million households per year, assuming a size of 2.5 kW and a capacity factor of 15%. A further challenge is, of course, that this solar generation will not necessarily be available at the times required.
These calculations are merely illustrative but they do highlight that the modularity versus economies scale argument need not necessarily work always in the favour of renewables. Solar panels are modular and highly scalable, but large-scale parks are not, given the land acquisition and transmission infrastructure developments required. It is worth noting, for example, that in 2017 China installed a record 50 GW of solar capacity, grew its solar generation by 75% yoy, but still had to increase its coal generation by 4% yoy (from a huge base of 4200 TWh in 2016), in order to meet 6.6% electricity demand growth between 2016-2017 (7). Thus, the pace of demand growth in developing countries is itself a challenge for the transition to higher shares of renewables.
The second aspect of the concept of convenience relates to grid integration. The integration of non-dispatchable renewables requires substantial changes to the operations and investments of the power system. Jurisdictions which have achieved a high share of variable renewables tend to share certain characteristics, which do not necessarily hold for developing countries. These include in particular stagnant or even falling demand (for example, UK); a high share of responsive gas, hydro or import/export capacities relative to net load levels (e.g. South Australia and California); highly developed electricity markets which provide strong and sophisticated price signals for flexible capabilities and operation (Texas); as well as a prevalence of high capacity factor renewable resources such as world-class onshore wind (Texas) or offshore wind (UK).
Thus, although there are certain advantages of building a largely greenfield system to integrate variable renewables, there are characteristics of developing country power systems that could exacerbate the grid integration challenge. These include notably the rapid rate of demand growth, smaller ratio of existing flexible capacities to net load, highly seasonal wind regimes based around the seasonal monsoon, and immature power markets with muted price signals.
Developing countries will be at the forefront of industrial and transport emissions growth: the progress on driving down the costs of low-carbon options described above pertains largely to the electricity sector. The global carbon intensity of electricity production has declined by 11% between 2005- 17 (almost all of which has been achieved in the last 4-5 years of the period). By contrast the CO2 intensity of clinker production has declined only 4% in the same period (8), and only 0.02% for steel (9). Thus progress on unlocking technological options for decarbonization has been piecemeal, and the socalled “hard-to-abate” sectors in industry have made negligible progress (10).
Incremental demand for these products will come largely from developing countries. However, they do not necessarily have the technological capacities to lead the innovation and commercialization of breakthrough decarbonization technologies in these sectors. Consider the case of India. India’s steel production per capita is just 11% that of China, about 30% that of other emerging economies, and about 25% that of advanced economies, and is hence expected to triple or even quadruple over the next 10-20 years. Yet, just steel, cement and chemicals already made up about 27% of India’s CO2 emissions from fossil fuel combustion and process emissions in 2017 (11). As India’s power sector decarbonizes according to a least regrets pathway based on costeffective renewables (including grid integration costs and challenges), emissions from the hard-to-abate sectors will become more and more salient.
Developing countries thus face a paradox: in the future, they will be the source of emissions which they are least able to address. They have a real stake in the global development of options to address industrial emissions.
The discussion above has some important implications for energy transition policy at the domestic level in developing countries, and global policy. The focus must be less on “flagship technologies” (12), like wind and solar generation, and more on the new enabling conditions and technologies, which would allow deeper emissions reductions beyond what will be achieved thanks solely to the cost-competitiveness of renewables. These include intraday and seasonal electricity storage; CCS and CCU; hydrogen electrolysis and power-to-gas; and hydrogen to chemical routes.
Proposal 1: G20 Countries Should Announce A 2030 Deployment and Cost Target for Stationary Storage and A Related Initiative to Scale-Up R&D in Grid-Scale Energy Storage
For developing countries, most of which lie between the Tropic of Cancer and Tropic of Capricorn, solar PV is expected to be the predominant renewable resource. In addition to the supply-side flexibility and demand-side flexibility, storage is expected to be a crucial technology for integrating large share of solar PV. However, for energy arbitrage (i.e. the intraday shifting of energy from surplus periods of production to shortage periods), the dominant battery storage technologies are projected to still be relatively expensive to provide bulk energy at night based on solar PV charging in the day-time. By 2030, the levelized cost of storage for energy arbitrage are projected to be in the order of 175 USD/MWh, falling to 100 USD/MWh around 2040 (13). A power system based thus largely on cheap daytime solar PV and more expensive nighttime storage would still be relatively expensive.
At the same time, the R&D and deployment effort for stationary storage is still inadequate and poorly coordinated. In the 12-year period from 2005 to 2017, IEA country R&D in “Other power and storage technologies” has grown from only 4% to around 8% of energy-related R&D (14). In turn, energy-related R&D has grown 3.2% per year, roughly the rate of real global GDP growth in this period, but above the rate of IEA country economy growth. Arguably, the place accorded to storage technologies does not reflect its crucial importance in facilitating the energy transition at a global level, and particularly in developing countries expected to rely on a large share of solar PV. In comparison, nuclear received almost three times the level of public R&D support as storage technologies.
In this context, G20 countries should announce a stretch goal for stationary storage deployment in their power systems, in order to give a strong orientation to business strategists, researchers and innovators. At the same time, as part of Mission Innovation (15), the goal should be announced to raise the share of public R&D budgets going to storage substantially above current levels.
Proposal 2: G20 Countries Should Announce A Platform For Low-Carbon Industry and Goals for the Deployment of Pilot Projects
The G8 summit in 2008 in Hokkaido launched a commitment to develop 20 large-scale CCS projects globally by 2010, to enable broad deployment of CCS by 2020. Clearly, this commitment did not succeed to the extent desired (16). The economics of CCS have largely been overtaken by renewables in the power sector. However, CCS has a crucial role to play in mitigating industry emissions, particularly unavoidable process emissions in the cement sector. In the case of steel, the preferred option was for a long-time a traditional coke-fired blast furnace with coke as the reducing agent, and CCS capturing end-of-pipe emissions. Recently, however, there has been increasing interest in hydrogenbased steel, with hydrogen from renewable electrolysis providing the fuel and reducing agent (17).
Developed countries should drive the development and commercialization of new frontier technologies for lower carbon industry products. The G20 could play a facilitator role by announcing stretch objectives for the establishment of pilot projects, for e.g. alternatives to fossil fuels for the provision of high-grade process heat and hydrogen steel demonstration facilities.
Proposal 3: Reallocating Funding to Assist Developing Countries in Meeting the New Paradigm
Given the cost improvements in renewables and energy efficient technologies, the paradigm of “incremental cost” is no longer appropriate with respect to large parts of the energy transition required. Aspects of the transition are underway and autonomous. This can be seen in the projections of McKinsey’s 2019 energy outlook reference case, without additional policies, renewables are projected to account for over 50% of global electricity supply by 2035, up from 24% in 2015 (18). Primary energy consumption is projected to grow much more slowly than in the past, and peak and plateau around 2030. These transitions are baked into the system.
International funding has been crucial in de-risking and lowering the financing cost of the first generation of renewables deployment policies in developing countries. In India, low cost international capital facilitates the cheap refinancing of renewables projects after several years of operations and proven cashflows. For example, in India in the year October 2017 to September 2018, the foreign commercial borrowing of the renewables sector was some 3.6 billion USD. By comparison, we can estimate the investment value of the projects commissioned in the same period at 6.5 billion USD (19). International commercially-based flows are happy to come in based on the sound policy environment and underlying positive economics for renewables.
In the early and mid-2000s, renewables was a frontier investment for international public financiers. Market failure was evident. This is increasingly less the case. And yet renewables dominant the land-scape of global climate finance, making up 63% of total mitigation-related flows, with transportation making up another 25% (20). This left just 12% spread between other sectors/uses, with the industry sector not mentioned and 0.47% and 0.02% going to generically classified “Low Carbon Technologies” and “Non-Energy GHG Emissions Reductions”, such as industrial process emissions. There is a case for rebalancing sectors, and rebalancing risk profiles, to reflect the success of what has gone before in terms of launching the electricity sector, energy efficiency and personal passenger transport components of the energy transition, and the need to unlock transition options in industry and freight transport.
REFERENCES
• Ahman, M., Olsson, O., Vogl, V., Nyqvist, B., Maltais, A., Nilsson, L., . . . Nilsson, M. (2018). Hydrogen steelmaking for a low-carbon economy . Stockholm: Stockholm Environment Centre and Lund University .
• CEA. (2019). Executive Summary on Power Sector January 2019. New Delhi: Central Electricity Authority .
• CSI. (2019, 03 01). Cement Sustainability Initiative. Retrieved from GNR Reporting Project CO2: https://www.wbcsdcement.org/GNR-2016/world/GNRIndicator_71AG-world.html
• Enerdata. (2018). Global Energy and CO2 Statistics. Retrieved 04 03, 2018, from https://globaldata.enerdata.net/database/
• Enerdata. (2019, 03 01). Odyssee Energy Efficiency Data. Retrieved from https://odyssee.enerdata.net/database/
• GlobalData. (2019, 03 05). Power Database. Retrieved from https://power.globaldata.com/HomePage/Index
• IEA. (2018). IEA World Energy Statistics Online. Retrieved 08 10, 2018, from https://data.iea.org//payment/products/118-world-energy-statistics-2018- edition.aspx
• Krishna, A. (2017). The Broken Ladder: The Paradox and Potential of India’s One Billion. New Delhi : Penguin Books.
• Maddison Project Database. (2018). Rebasing ‘Maddison’: new income comparisons and the shape of long-run economic development. Groningen: Groningen Growth and Development Centre.
• McKinsey & Co. (2019). Global Energy Perspectives 2019: Reference Case. McKinsey and Company .
• Oliver, P., Clark, A., & Meattle, C. (2018). Global Climate Finance: An Updated View 2018. London & San Francisco: Climate Policy Initiative.
• PEG. (2019, 03 01). Renewable Energy Costs and Prices. Retrieved from Renewable Energy Data Portal: https://prayaspune.org/peg/re-prices.html
• RBI. (2019). External Commercial Borrowing Database. Mumbai, India: Reserve Bank of India.
• Ritchie, H., & Roser, M. (2019, 02 28). Fossil Fuels. Retrieved from OurWorldinData.org: https://ourworldindata.org/fossil-fuels • RTE. (2017). Billan Provisionnel 2017. Paris: Reseau de Transport de l’Electricite .
• Schmidt, O., Melchior, S., Hawkes, A., & Staffell, I. (2019). Projecting the Future Levelized Cost of Electricity Storage Technologies. Joule, 81-100.
• Smil, V. (2017). Energy and Civilization: A History. Cambridge, Mass: MIT Press.
• Spencer, T. (2018). Rising CO2 Emissions in 2017: What’s Going on in China? Paris: IDDRI.
• World Bank. (2018). World Development Indicators. Retrieved 04 22, 2018, from https://databank.worldbank.org/data/reports.aspx?source=wdi-database-archives- %28beta%29


