The COVID-19 pandemic has forced a trade-off between limiting its health impact and maintaining economic activity. Welfare economics offers tools to conceptualize this trade-off. We review four such tools: value of statistical life (VSL), value of statistical life years (VSLYs), quality-adjusted life-years (QALYs), and social welfare analysis. We find the last tool to be superior. We discuss how to choose policies that affect people’s wellbeing differentially. We argue for evaluating policies using a social welfare function, which should especially consider increasing the wellbeing of the less well off. We propose a model to illustrate how this framework can evaluate two policy types in response to the pandemic: eradication of the virus, and more lenient control of the spread. The evaluations depend on empirical facts but also on key value judgments about the relative importance of health and concern for the worse off. The purpose of this brief is not to make precise recommendations, as conditions vary widely across countries and over time, but to provide a methodology.
Challenge
The COVID-19 crisis has put all governments in difficult positions. In the absence of extensive testing capacities, they have to resort to near-universal lockdowns and social distancing measures, which both exact a severe economic toll. While developed countries can provide temporary support to avert business collapse and worker hardship due to lack of liquidity, most developing countries cannot do so.
However, by quarantining travelers, testing, and labor-intensive contact tracing before the number of infections rose to unmanageable levels, some states have managed to ward off the first wave of the pandemic. South-East Asian countries even managed to do so despite the fact that their first cases surfaced in January, before other countries took serious measures. They also relied on the cooperation of their populations, which are accustomed to public health campaigns and protection against infectious diseases. As a result, many developing countries have benefited from a longer warning period and might be able to emulate these strategies.
Even in countries where the virus has spread widely, it is technically possible to control the pandemic. The lockdown measures in many countries suppress the reproduction rate of the pandemic to numbers that can guarantee local eradication within a few months. It is also possible to keep the pandemic under control by periodic lockdown episodes of a few weeks until a vaccine is found. Two pressing questions about these policies of suppression and control are: (i) how should we conceptualize the benefits and burdens compared to a policy of uncontrolled spread and (ii) how do we balance these benefits and burdens to determine which policy is superior?
Proposal
We propose that governments rely on transparent evaluation methods to assess the wellbeing impacts of the pandemic and the policy responses. There is considerable uncertainty around key parameters of the pandemic and the reaction of the economy to the related exceptional measures. Nevertheless, it is possible to determine an order of magnitude for key policy decisions. No government can focus exclusively on epidemiological or economic considerations, as the wellbeing of a population depends on both health and wealth. Finding the right balance requires relying on sound ethical principles and the careful estimation of possible scenarios. Further, obtaining the understanding and cooperation of the population, which may be crucial for successful implementation, requires clarity of the objectives and value judgments underlying the chosen policy.
Evaluation methods
How do we determine what economic cost is worth bearing to reduce the number of deaths and other negative effects of the COVID-19 pandemic? A well-known, but often criticized, method of policy evaluation is benefit–cost analysis (BCA), which converts the effects of a policy into monetary equivalents and sums them up. Alternatively, social welfare analysis determines the effects of a policy on individual wellbeing and applies an aggregation formula for the entire population. We briefly survey these methods and emphasize the advantages of the latter.
The monetary measure for the value of saving lives most widely used in BCA is the value of a statistical life (VSL). People at risk would be willing to pay to increase their chance of survival. VSL is derived from the rate at which people are willing to trade off small changes in their income against small changes in their risk of death. It is estimated based on individuals’ reported preferences or based on workplace and consumption behaviors, such as choices amongst jobs involving different levels of risk or purchases of risk-reducing equipment. For example, if someone would accept a pay cut of at most USD 1,000 per year to reduce their annual mortality risk by 0.1%, we say that the monetary value of their statistical life is USD 1,000,000. Note that this is not the same as saying that they would be willing to accept USD 1,000,000 in return for certain death or would pay this amount to guarantee their survival. Rather, it means that each of 1,000 people, identical in all relevant ways, considering their self-interest alone, would be willing to pay an equal share of a USD 1,000,000 cost for something that reduces the expected fatalities in a year by one.
A person’s VSL can depend on characteristics such as age, income, and wealth or the overall risk level they face. This can have unacceptable consequences for BCA.
Particularly, the fact that someone who is well off is likely to place a higher monetary value on risk reduction than someone who is less well off implies that if individualspecific VSL is used in a BCA of policies, the interests of the well off count more than those of the less well off.
By using a single VSL such as the population average, rather than individual-specific ones, this problem is avoided but others are then created. It seems reasonable to treat people in different age-groups differently when assessing policies (Adler et al. 2019). Death is certain for all and is commonly considered a more serious loss from the societal and ethical perspective when it occurs earlier in life. The skewed age distribution of COVID-19 fatalities makes this problem especially pressing.
A common solution is using a different measure for policy evaluation: the value of a statistical life year (VSLY). The VSLY is obtained by dividing the average VSL of the population by the average life expectancy remaining (an individual’s current life expectancy remaining is the number of years he/she can be expected to live, if he/she does not die now). The value of saving the life of someone in any particular age cohort is given by the product of the VSLY and the life expectancy remaining for the cohort. This yields a value for life saving that varies by age.
A criticism of both VSL and VSLY is that they do not consider the quality of life. For example, many people would not regard a year of life spent bed-ridden as equivalent to a year of life in excellent health. As such, the quality adjusted life years (QALYs) allow the value attributed to a life saved to depend on both its remaining length and quality. The value of living in an impaired health state (e.g., with diminished lung function due to COVID-19) is derived from people’s preferences. These preferences may be elicited in a number of ways. For instance, individuals may simply be asked to assign a numerical value to life in a particular health state in comparison to death and life in full health. Alternatively, they may be asked how they would balance a longer life in an impaired state against a shorter, healthier life or what risk of death they would be willing to accept to be fully cured of impaired health. However, these preferencebased assessments can be questioned (Hausman 2015). For example, healthy people are poor predictors of what life would be like in states of impaired health (Dolan and Kahneman 2008, Walasek et al. 2019). Nonetheless, rough indicators of the quality of life in impaired health states are better than measures that neglect quality altogether. This is relevant to the current pandemic, in which it is important to consider the often substantial effects of contracting the illness on those who do not die from it. For this reason, the use of QALYs in public health decision making is widespread.
Its use is also controversial. One key concern is that, when it comes to life extension, the use of QALYs regards the life years gained by people who would, if saved, be in good health as more valuable than the life years gained by people who would live with disabilities or in poor health. This is because extending the lives of the former would generate a higher health-related quality of life (National Council on Disability 2019). In our view, this objection is best addressed not by rejecting the use of QALYs, but by assigning special values to improvements in the quality (and length) of life for those who are worse off (John, Millum, and Wasserman 2017).
Estimates of the VSL and VSLY vary considerably between countries. Part of this variation is due to differences in the income per capita. For example, Robinson, Hammitt, and O’Keefe (2019) recommend calculating the average VSL for a country by multiplying the country’s per capita income by a factor proportional to the square root of the per capita income (but no smaller than 20). The VSLY can be calculated by dividing the VSL by the average remaining years of life. For the USA, the typical VSL is around USD 10,000,000 and the VSLY a little over USD 300,000 (see also Kniesner and Viscusi forthcoming).
A similar variation is observed in the monetary costs that public actors regard as reasonable to gain one QALY. One approach is to estimate the value of a QALY by dividing the VSL by the average remaining QALYs (Hirth et al. 2000). This produces values modestly larger than the VSLY. By contrast, the World Health Organization (WHO) suggests that interventions that generate a QALY for less than one time per capita income are good value for money and interventions that generate a QALY for up to three times per capita income may be worth the cost (Bertram et al. 2016). In line with this formula, for the USA, the Institute for Clinical and Economic Review suggests values between USD 100,000 and USD 150,000 for one QALY (ICER 2018). By contrast, the British National Institute for Health and Care Excellence applies figures from USD 25,000 to USD 40,000 for one QALY (NICE 2008). The fact that these countries have different per capita incomes only partially explains these differences. As we show below, the ranking of policies to deal with the pandemic based on BCA may well depend on which values are adopted. It is therefore critical that attention be given to the justification of any choice.
The alternative approach we emphasize here—social welfare analysis—measures the joint health and economic impact of policies on individual wellbeing and then aggregates individual wellbeing gains and losses to yield an overall measure of how beneficial a policy is (Adler et al. 2014). This method has a singular advantage over the BCA as follows. Unlike population-average VSL, the individual-specific wellbeing values that social welfare analysis uses are sensitive to individual characteristics, such as age and income. While the individual-specific VSL, VSLY, and QALYs of the well off are inflated, relative to those of less well off individuals, as money has relatively lower marginal value for the well off, this is not true of wellbeing values. Therefore, the aforementioned bias that the use of individual-specific monetary values introduces into BCA in favor of the well off does not plague social welfare analysis.
Social welfare analysis begins with measuring the wellbeing levels associated with different possible lives, represented by bundles of goods that matter to individuals: income, health, longevity, and so on. Many methods are used to obtain these measures (for a review, see Adler and Fleurbaey 2016). For instance, one draws on reported levels of subjective wellbeing or life-time satisfaction scores to identify the determinants of wellbeing (Clarke et al. 2018, Layard et al. 2020). Another derives a wellbeing measure from individual preferences between probability distributions (lotteries) over alternative possible lives (Adler 2019). Yet another relies on income, corrected for the value of non-market aspects of life, such as longevity, based on population preferences over these aspects (Blanchet and Fleurbaey 2013). Finally, the capability approach measures opportunities in the various aspects of life (Sen 1999).
The effect of a policy that reduces the risk of contracting COVID-19 by some percentage and at some financial cost can be modeled by the shift in the distribution of population wellbeing levels generated by the bundles of longevity, health, and income mentioned above. This shift captures not just the impact on individuals’ longevity and health of the policy but also how these factors—together with income—co-determine changes in individuals’ wellbeing. Therefore, it provides all the information required for a comprehensive analysis of the overall effects of implementing the policy.
To determine these overall effects, social welfare analysis aggregates the set of individual wellbeing values achieved by implementing the policy. It does so by means of a social welfare function (SWF) that assigns a measure of social value to each distribution of individual wellbeing. A commonly used SWF is the utilitarian one, which assigns to each set of individual wellbeing values the total (or average) of these values. However, this way of aggregating individuals’ wellbeing is insensitive to wellbeing inequalities in the population, that is, it is indifferent to whether a given increment in wellbeing accrues to a well off person or not. In this respect, it contradicts the common conception that a given improvement in the wellbeing of the worse off matters more than the same improvement to the well off, because it comes to those who have the greatest need or because such improvements reduce inequality (Adler 2019; Voorhoeve 2019). This problem can be addressed by using distribution-sensitive SWFs that prefer policies producing wellbeing gains for those with low wellbeing over policies producing the same wellbeing gains for those better off.
The choice of SWF is fundamentally ethical, as it requires balancing the wellbeing interests of different individuals. This is a second important advantage of social welfare analysis. It allows these ethical choices to be made more explicitly and transparently than under BCA, which largely ignores the distribution of benefits and burdens among individuals.
Reviewing policy options: An illustration
To illustrate these approaches, a model simulating the pandemic, as well as lockdown and testing policies, has been developed and adapted to several countries (USA, UK, France, Belgium, and Guinea).[1] The model considers inequalities in income and life expectancy across social groups and allows for various assumptions about the distribution of the economic cost and the fatality burden among these groups. Such assumptions relate to policy choices about social protection and income support, as well as access to healthcare. However, this model is not designed to make predictions or precise policy recommendations, but rather highlights the parameters relevant to sound decision making.
We focus on the comparison between a suppression policy that implements a lockdown order (“contact reduction” of a certain percentage) for as long as it takes to make the virus almost completely disappear and a control policy that limits the lockdown to periods when fatalities are over a certain threshold. The latter policy may also eventually cause the virus to disappear nearly completely, but over a longer period of time and using a succession of shorter lockdown episodes rather than a longer single one. Supplementary policies (testing, mask wearing, income support) can also be considered and will modify the evaluation. The simulations we present include testing and mask wearing through the “contagion reduction” they entail. We assume that only contact reduction has a substantial economic cost, because testing and producing protective equipment have relatively low costs and do not slow down economic activity—even if displacing resources toward them has an opportunity cost. Here, the discovery of a treatment or vaccine is assumed to come too late to affect the evaluation of these policies.
Fig. 1a illustrates the policy problem. The model starts with a single infection in week 1, which then spreads over the population. The policies (suppression or control) start on a particular week (from weeks 10 to 23) and continue until the pandemic virtually disappears. Either policy entails an economic cost (due to lockdown)[2] but also saves lives compared to the absence of intervention. The graphs do not show the outcomes over time, but rather the final outcome (economic cost and fatalities) as a function of when the policy is initiated. When the policy starts on week 23, it is as if no intervention took place, because the first wave of the pandemic has almost fully passed. Therefore, our analysis also covers the case of uncontrolled spread. The scissor patterns for both policies show that an early policy saves more lives (although a very early control policy is counterproductive because it hinders the build-up of collective immunity), but has greater economic cost because it requires longer lockdown episodes.[3]
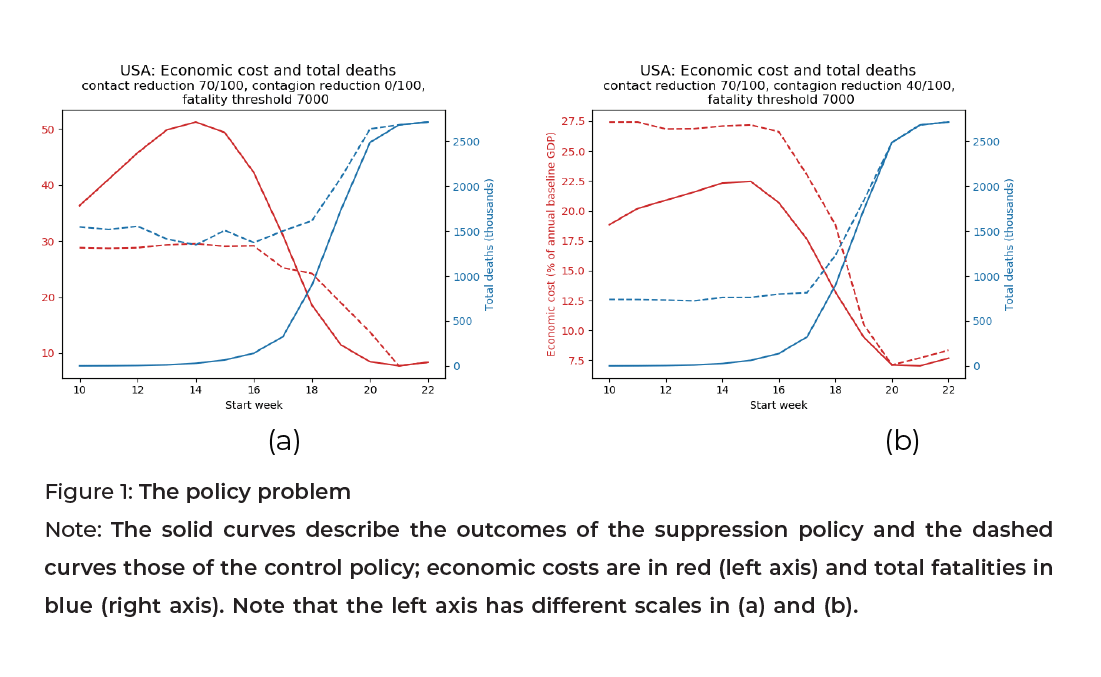
The contrast between Fig. 1a and 1b shows the complementarity of contagion reduction with contact reduction. In the absence of contagion reduction (Fig. 1a), the control policy is less costly but also saves fewer lives. With ambitious contagion reduction (Fig. 1b), by contrast, control is dominated by suppression because the latter saves more lives at a smaller cost. This occurs because due to the contagion reduction, the suppression of the virus can be achieved in a shorter time.
The BCA can be illustrated using the contrast between the VSL and VSLY approaches in the COVID-19 context, where victims are mostly the elderly (at least in developed countries). This is shown in Fig. 2, which displays hypothetical simulations for the total cost (adding up the value of lives lost to the crisis and the economic cost).
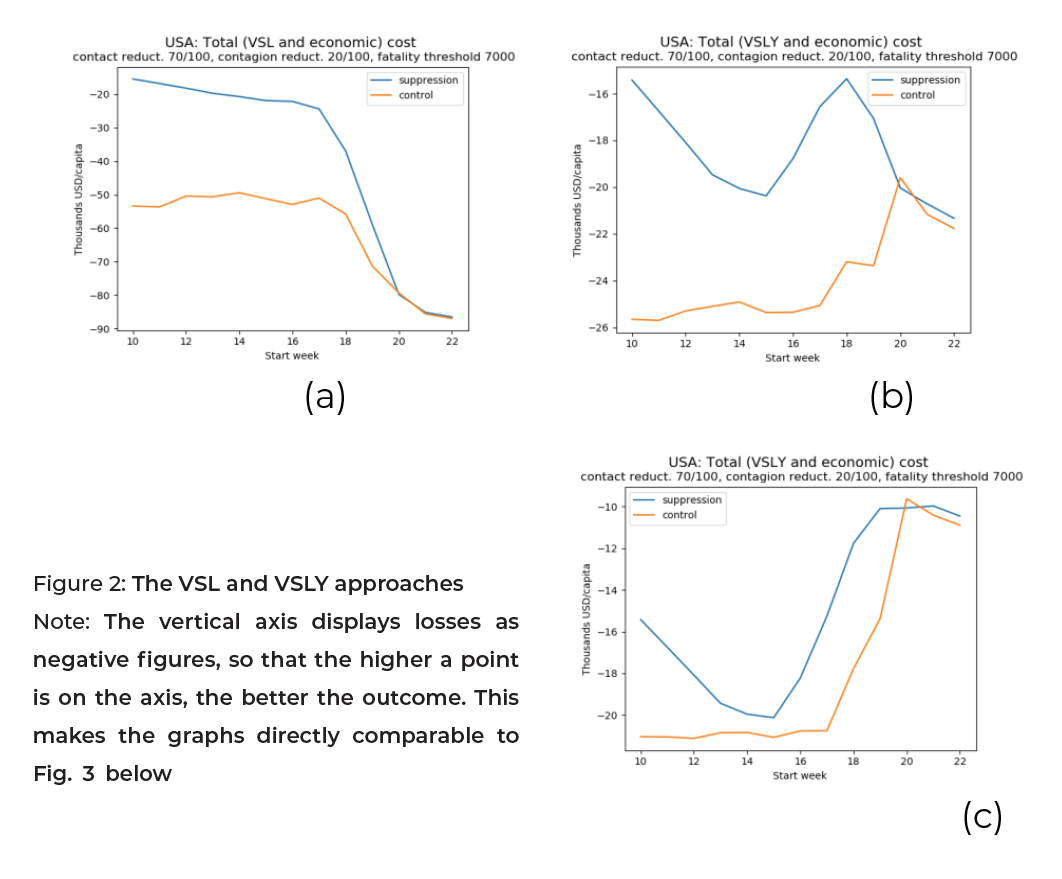
In Fig. 2a and 2b, both approaches favor the eradication policy over the control one. Specifically, the VSL approach is favorable to early eradication, whereas the VSLY approach condones letting the virus spread before eradication is implemented. This is because elderly victims do not lose many years of life. These two graphs rely on a VSL equal to 150 times the Gross Domestic Product (GDP) per capita and a VSLY equal to three times the GDP per capita. Fig. 2c relies on a lower VSLY, equal to the GDP per capita. In this figure, despite the staggering death toll, delaying policy adoption is acceptable and late adoption of either policy is optimal. This illustrates how crucial the ethical parameter for the value of life is.
The SWF approach is also implemented in the model. Namely, individual wellbeing is computed for a whole life, not just a year, and depends on income and longevity. It is also calibrated in a way that guarantees that the average individual’s willingness to pay for a life year is equal to the same VSLY used in the BCA method (three times the GDP per capita). In this way, in the absence of priority for the worse off, the VSLY approach and the social wellbeing approach deliver similar assessments. However, when a degree of priority for the worse off is introduced, the evaluations can differ markedly. The social wellbeing approach is then uniquely sensitive to three considerations as follows.
First, given the assumptions about the value of longevity, the worse off include the victims of the virus, because their loss of longevity is a substantial wellbeing loss. Concern for the worse off thus implies a greater significance for health outcomes. However, many of the victims have attained an old age. Compared to younger survivors, they have the advantage of having avoided other fatality risks to reach that age but also the disadvantage of having lived earlier, in less affluent economic times. The worst off tend to be middle-aged victims, whose premature deaths are great losses.[4]
Second, inequalities in life expectancy and fatality rates across social groups reinforce the concern for health, because the worse off in terms of income incur a double penalty through a greater health toll. Unlike under the BCA, the SWF approach clearly identifies the value of policies that give greater access to healthcare and reduce the correlation between health and income.
Third, inequalities in the economic cost of a lockdown may attenuate the previous considerations if disadvantaged social groups are more severely affected by the economic slowdown.[5] This is especially relevant for poor countries, in which the most disadvantaged may fall into extreme poverty under these circumstances. When priority is given to the worse off, the SWF approach favors strong social protection measures that ensure a more equitable distribution of economic cost. This point is illustrated in Fig. 3, which displays an example of a measure of societal wellbeing—the equivalent income. This is defined as the level of income per capita that, when equally distributed and associated with equal longevity for everyone, would yield the same societal wellbeing as the contemplated (unequal) situation.
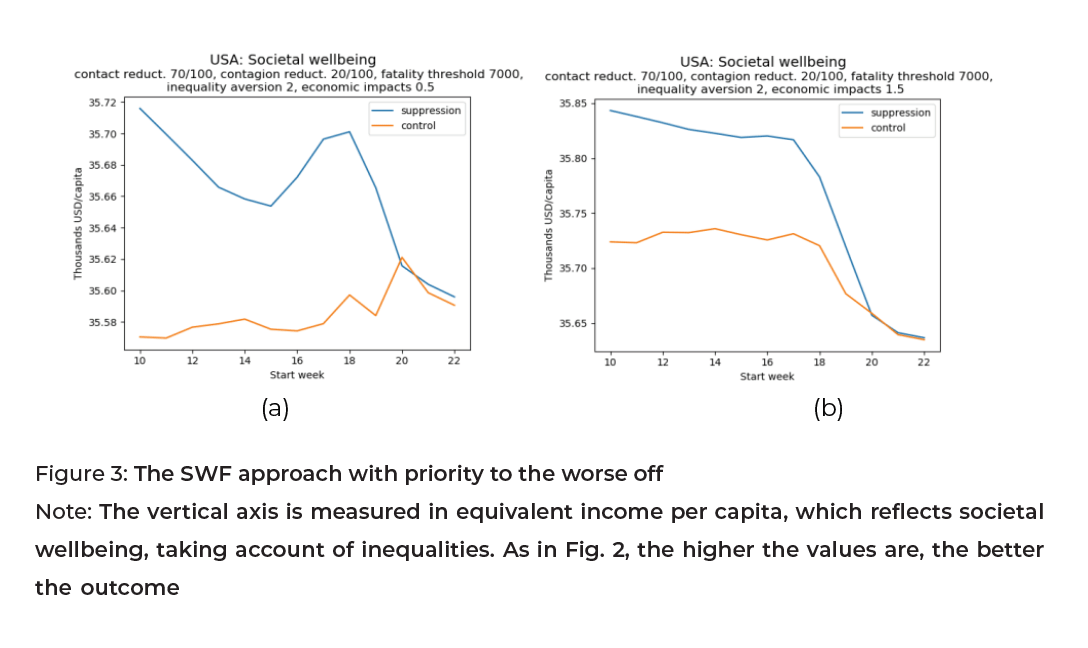
In Fig. 3, the elasticity of the economic cost to income is either 0.5 (Fig. 3a), meaning the cost distribution is regressive, or 1.5 (Fig. 3b), meaning the distribution is progressive.[6] The priority for the worse off is substantial in Fig. 3, implying that improving the wellbeing of an individual who is half as rich is four times as important for social welfare.
Fig. 3a illustrates that if the lower income groups in the population bear a disproportionate economic burden and if this economic burden is heavy due to a lack of contagion reduction, then late adoption may be preferred to the mid-time adoption of a suppression policy. This is because the economic cost is substantial when the policy starts in the middle of the time range. Further, the late adoption of a control policy is preferred to any other time. By contrast, Fig. 3b illustrates the situation in which, with a progressive economic distribution, early policy adoption is preferred when eradication is considered. As far as the control policy is concerned, a late policy adoption is not optimal.
There are many parameters on which these simulations depend, but they cannot be discussed here in detail. For instance, if contact reduction can be increased from 70% to 80%, early eradication is much quicker and much less costly. It is preferable even if one adopts a low figure for the value of life, keeping the other parameters as in Fig. 2c. The model incorporates spontaneous contact reduction by individuals when they witness a mortality peak or additional fatalities when hospitals are overwhelmed. The results would also change with the early discovery of a treatment, which would lower the fatality rate and enhance the relative value of controlling the pandemic compared to full suppression. The population demographic structure and background health conditions may affect the lethality of the virus. In higher-income countries, deaths are concentrated in the elderly group. In developing countries, worse background health makes younger patients more vulnerable than in rich countries. However, there are important missing elements in these simulations. Particularly, they do not assume any spatial heterogeneity between regions in a country, they ignore possible contamination by travelers from abroad, and do not finely distinguish between different age groups. They also ignore the possible longer-term economic and health consequences of the crisis.
The upshot of these remarks is that precise prediction with this—or any other model—is not possible at the moment. This policy brief primarily proposes this methodology as a framework to study the combined effects of different values for relevant empirical, and ethical parameters on policy conclusions. When available, more precise predictions can be introduced to support decision-making that is both scientifically and ethically well-informed.
Our model shows how sensitive the path of the pandemic is to the various parameters, reflecting the high uncertainty, which makes decisions difficult for policymakers. From a policy viewpoint and the figures presented here, it is tempting to conclude that near-total suppression of the virus is, in most cases, the dominant policy. However, the duration of the required lockdown period can stretch over 4 months at a 70% contact reduction (3 months at 80% contact reduction) if the start date is around weeks 15–16 in our simulations, as is the case in many countries.[7] This means that, even when public health authorities are convinced that eradication is the best policy, implementing it may be politically difficult. It would require very strong support measures for populations suddenly deprived of work and income. If midway toward near-eradication the authorities revert to a more modest control strategy, much of the effort would have been in vain. They would have only pushed the infection wave into the future (see also Gollier 2020; Kissler et al. 2020). This is why a clear communication on the strategy and ethical choices, based on rigorous modeling—as proposed here— may be crucial to convince the population of the need to stay the course.
The current crisis presents a difficult trade-off between lives and livelihoods, especially for governments in fragile states or with frail leadership and a low degree of cooperation from the population. However, it is possible to lay out the main considerations that guide policy, including the key normative issues of valuing lives and giving priority to the worse off. Our quantitative analysis illustrates how the relevant empirical and normative elements of sound policy-making can be combined into a rigorous framework. The SWF approach, which considers the distribution of impacts and background inequalities, is more attractive than the BCA approach and more consistent with the widely shared ethical views regarding life-saving by income and age.
Disclaimer
This policy brief was developed and written by the authors and has undergone a peer review process. The views and opinions expressed in this policy brief are those of the authors and do not necessarily reflect the official policy or position of the authors’ organizations or the T20 Secretariat.
References
Adler, Matthew D. 2019. Measuring Social Welfare: An Introduction. Oxford University
Press.
Adler, Matthew D., Maddalena Ferranna, James K. Hammitt, and Nicolas Treich. 2019.
“Fair Innings: The Utilitarian and Prioritarian Value of Risk Reduction over a Whole
Lifetime.” Duke Law School Public Law & Legal Theory Series No. 2019-79.
Adler, Matthew D., and Marc Fleurbaey. 2016. Oxford Handbook of Wellbeing and
Public Policy. Oxford University Press.
Adler, Matthew D., James K. Hammitt, and Nicolas Treich. 2014. “The Social Value of
Mortality Risk Reduction: VSL versus the Social Welfare Function Approach.” Journal
of Health Economics 35: 82–93.
Bertram, Melanie, Jeremy Lauer, Kees De Joncheere, Tessa Edejer, Raymond
Hutubessy, Marie-Paule Kieny, and Suzanne Hill. 2016. “Cost–Effectiveness Thresholds:
Pros and Cons.” Bulletin of the World Health Organization 94: 925–30. doi: https://dx.doi.org/10.2471/BLT.15.164418.
Clark, Andrew, Sarah Flèche, Richard Layard, Nattavudh Powdthavee, and George
Ward. 2018. The Origins of Happiness: The Science of Wellbeing over the Life-Course.
Princeton NJ: Princeton University Press.
Dolan, Paul, and Daniel Kahneman. 2008. “Interpretations of Wellbeing and Their
Implications for the Valuation of Health.” The Economic Journal 118 (525): 215–34.
Gollier, Christian. 2020. “Cost-Benefit Analysis of Age‑Specific Deconfinement
Strategies.” Covid Economics 24: 1-31.
Hausman, Daniel. 2015. “The Value of Health.” In Oxford Handbook of Value Theory,
edited by Iwao Hirose and Jonas Olson, 338–55. Oxford University Press.
Hirth, Richard, Michael Chernew, Edward Miller, Mark Fendrick, and William Weissert.
2000. “Willingness to Pay for a Quality-Adjusted Life Year: In Search of a Standard.”
Medical Decision Making 20 (3): 332–42. doi:10.1177/0272989X0002000310.
ICER (Institute for Clinical and Economic Review). 2018. “ICER Value Framework.”
Accessed May 23, 2020. https://icer-review.org/wp-content/uploads/2018/05/ICERvalue-framework-v1-21-18.pdf.
John, Tyler, Joseph Millum, and David Wasserman. 2017. “How to Allocate Scarce
Health Resources without Discriminating against People with Disabilities,”
Economics and Philosophy 33 (2): 161–86.
Kissler, Stephen, Christine Tedijanto, Edward Goldstein, Yonathan Grad, and Marc
Lipsitch. 2020. “Projecting the Transmission Dynamics of SARS-CoV-2 through the
Postpandemic Period.” Science 368 (6493): 860–868. DOI: 10.1126/science.abb5793.
Kniesner, Thomas J., and W. Kip Viscusi (forthcoming) “The Value of a Statistical Life.”
Oxford Research Encyclopedia of Economics and Finance. Vanderbilt Law Research
Paper No. 19-15.
Layard, Richard, Andrew E. Clark, Jan-Emmanuel De Neve, Christian Krekel, Daisy
Fancourt, Nancy Hey, and Gus O’Donnell. 2020. “When to Release the Lockdown: A
Wellbeing Framework for Analysing Costs and Benefits.” CEP Occasional Paper 49.
National Council on Disability. 2019. “Quality-Adjusted Life Years and the Devaluation
of Life with a Disability.” Bioethics and Disability Report Series (Nov. 6).
NICE (National Institute for Health and Care Excellence). 2008. Social Value
Judgments, Principles for the development of NICE guidance 2nd edition. Accessed
May 23, 2020. https://www.nice.org.uk/about/who-we-are/our-principles.
Robinson, Lisa A., James K. Hammitt, and Lucy O’Keeffe. 2019. “Valuing Mortality Risk
Reductions in Global Benefit-Cost Analysis.” Journal of Benefit-Cost Analysis 10 (S1):
15–50. doi:10.1017/bca.2018.26.
Sen, Amartya. K. 1999. Commodities and Capabilities. Oxford University Press.
Voorhoeve, Alex. 2019. “Why Health-Related Inequalities Matter and Which Ones
Do.” In Global Health Priority Setting: Beyond Cost-Effectiveness, edited by Ole F.
Norheim, Ezekiel J. Emanuel, and Joseph Millum, 145–62. Oxford University Press.
Walasek, Lukasz, Gordon D. A. Brown, and Gordon D. Ovens. 2019. “Subjective
Wellbeing and Valuation of Future Health States: Discrepancies between Anticipated
and Experienced Life Satisfaction.” Journal of Applied Social Psychology 49 (12): 746–
54.
Appendix
[1] . The Excel version of the model can be freely downloaded from https://sites.google.com/site/marcfleurbaey/ Home/covid. Users can change all parameters and assumptions and determine the timing and intensity of contact reduction and testing policies. Refined versions of the model (in Python code) are available upon request.
[2] . These simulations assume that contact reduction by 70% reduces the economic income during the lockdown period by 35% (half the percentage).
[3] . As shown in the graph, an early suppression policy can have a smaller cost, because a quick elimination of the virus is possible before it spreads widely over the population.
[4] . In the version of the model with which the figures have been produced, these considerations are incorporated in a simplified way. The victims are assumed to have had greater life expectancy than the average level of the population (because most of them have already reached an old age), whereas the (younger) survivors are assumed to face the prospect of a greater lifetime income. However, we make no detailed depiction of inequalities in income and fatality rates among age groups.
[5] . This particular model does not include long-term and indirect effects on people’s lives, but does include additional deaths caused by the disruption of healthcare (either on the supply or the demand side).
[6] . Income inequalities are represented by quintile groups. An elasticity of 0.5 means that a group with an income level greater by 1% compared to another group bears a share of the economic cost that is greater by 0.5% (therefore, the cost as a fraction of its baseline income is half a percentage point lower).
[7] . Most countries initially successful in eradicating the virus (e.g., Vietnam, New Zealand, or South Korea) have adopted early lockdowns and testing policies and have endured little damage compared to other countries. China appears to have implemented a very strict lockdown policy.


